
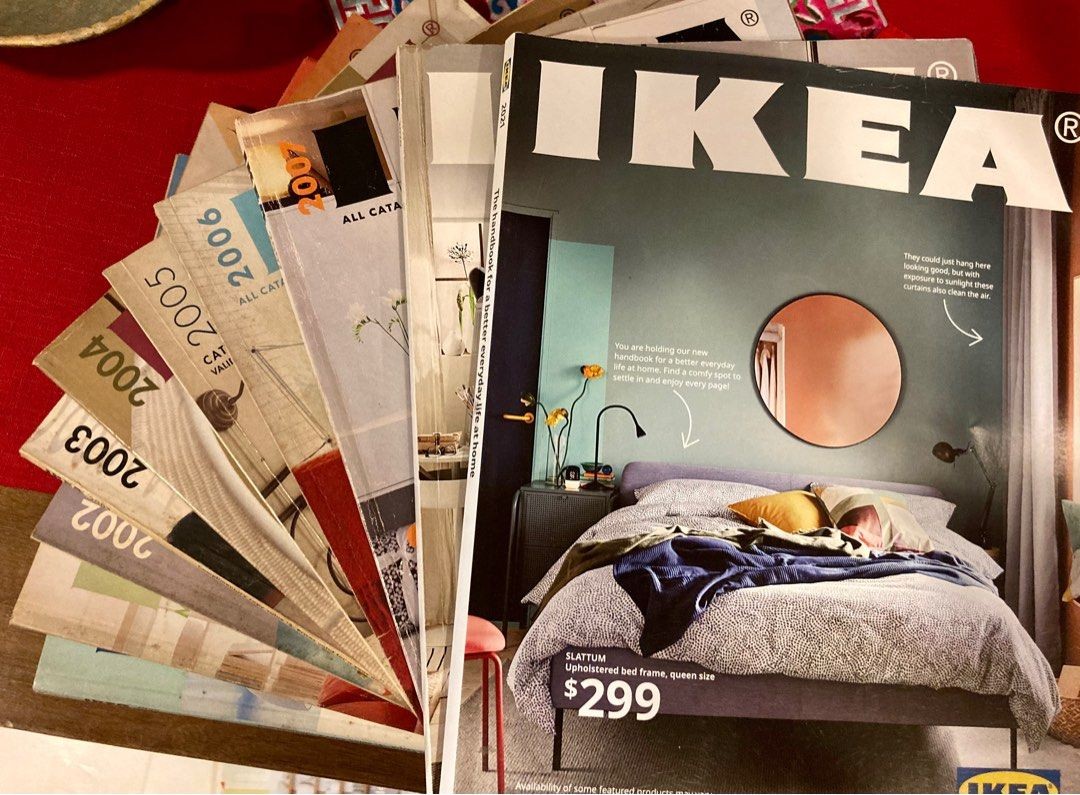
In 2017, the IKEA catalog produced over 200-million-copies each year. At the time, it was the world's most printed book. Recognizing this impact, IKEA worked to reduce the negative impact of their most important marketing instrument. Having exhausted the use of advisors Deloitte and KPMG's Life Cycle approach, they turned to the small systems-thinking agency of Except. The 3 year story that follows is nothing short of remarkable. It has impacted the world's paper and print supply around the world since, reducing billions of tonnes of CO2, and channeling billions of US$ into the transition of the paper and print industry.
Having exhausted the common life-cycle approach with Deloitte and KPMG, IKEA wanted to explore more innovative avenues. Except was asked to apply its holistic systems-oriented process, SiD, to the challenge. This is where this story, that helped to change the world's paper and print industry, starts.
The results are nothing short of breathtaking. And they continue to accumulate, as the impacts of this projects ripple onward for decades to come. Every book, every newspaper, every flyer you have in your hands today, has been affected by this revolutionary project.
With the largest print production on the planet, IKEA had achieved 100% Forest Stewardship Council (FSCTM) mix credit certification for the sustainable paper of all its brochures worldwide in 2014. It was a big win, but they were still looking for a game-changer to make the entire lifecycle of the catalog much leaner and greener.
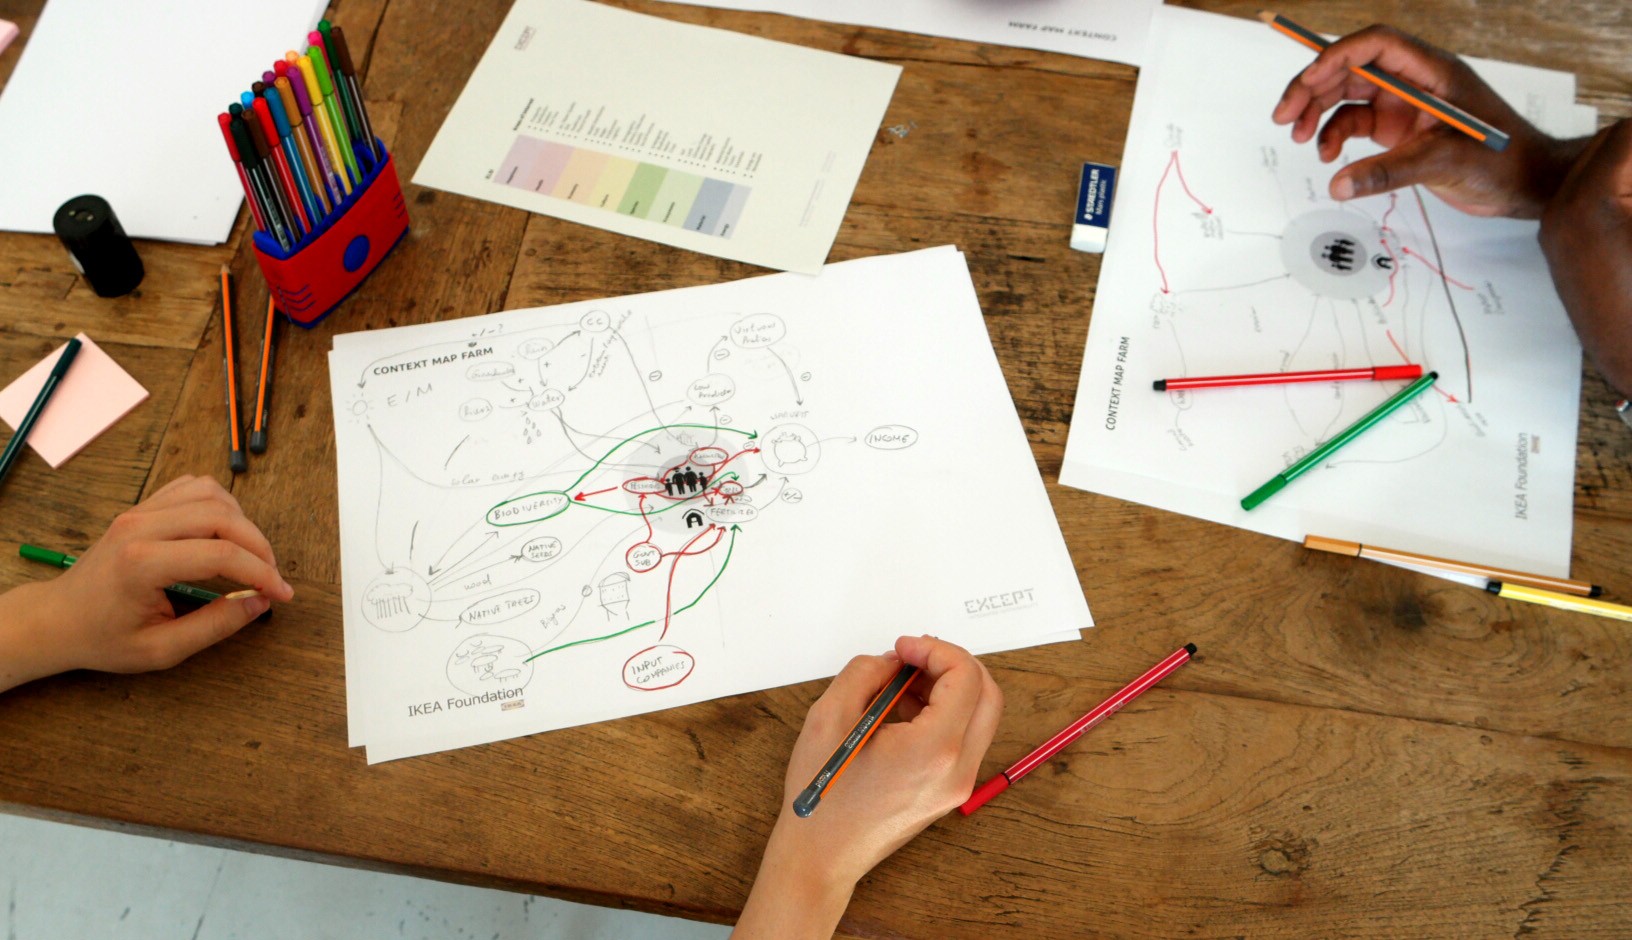
In spring 2014, a dozen specialists from IKEA and Except Integrated Sustainability dived head-long into a three-day innovation session at Except’s headquarters in Rotterdam to find that point of leverage. Fast-forward eight months, and IKEA’s purchasing managers have a brand-new purchasing interface that immediately decreased the catalog’s ecological footprint.
As a result of the significant contributions from all collaborating partners, by the end of 2015, IKEA already clocked a 484 GWh reduction in energy consumption from its catalog production process - the equivalent of 145,000 Swedish homes. CO2 emission from the catalog’s production dropped 19,000 tons, the size of 20% of Belgium’s annual CO2 emissions.
Using systems thinking and big data
Tom Bosschaert, founder and director of Except, explains: “We always look for the smartest lever to effect maximum change within a system, be it a company, the inner city of Shanghai, or a supply chain in this case.”
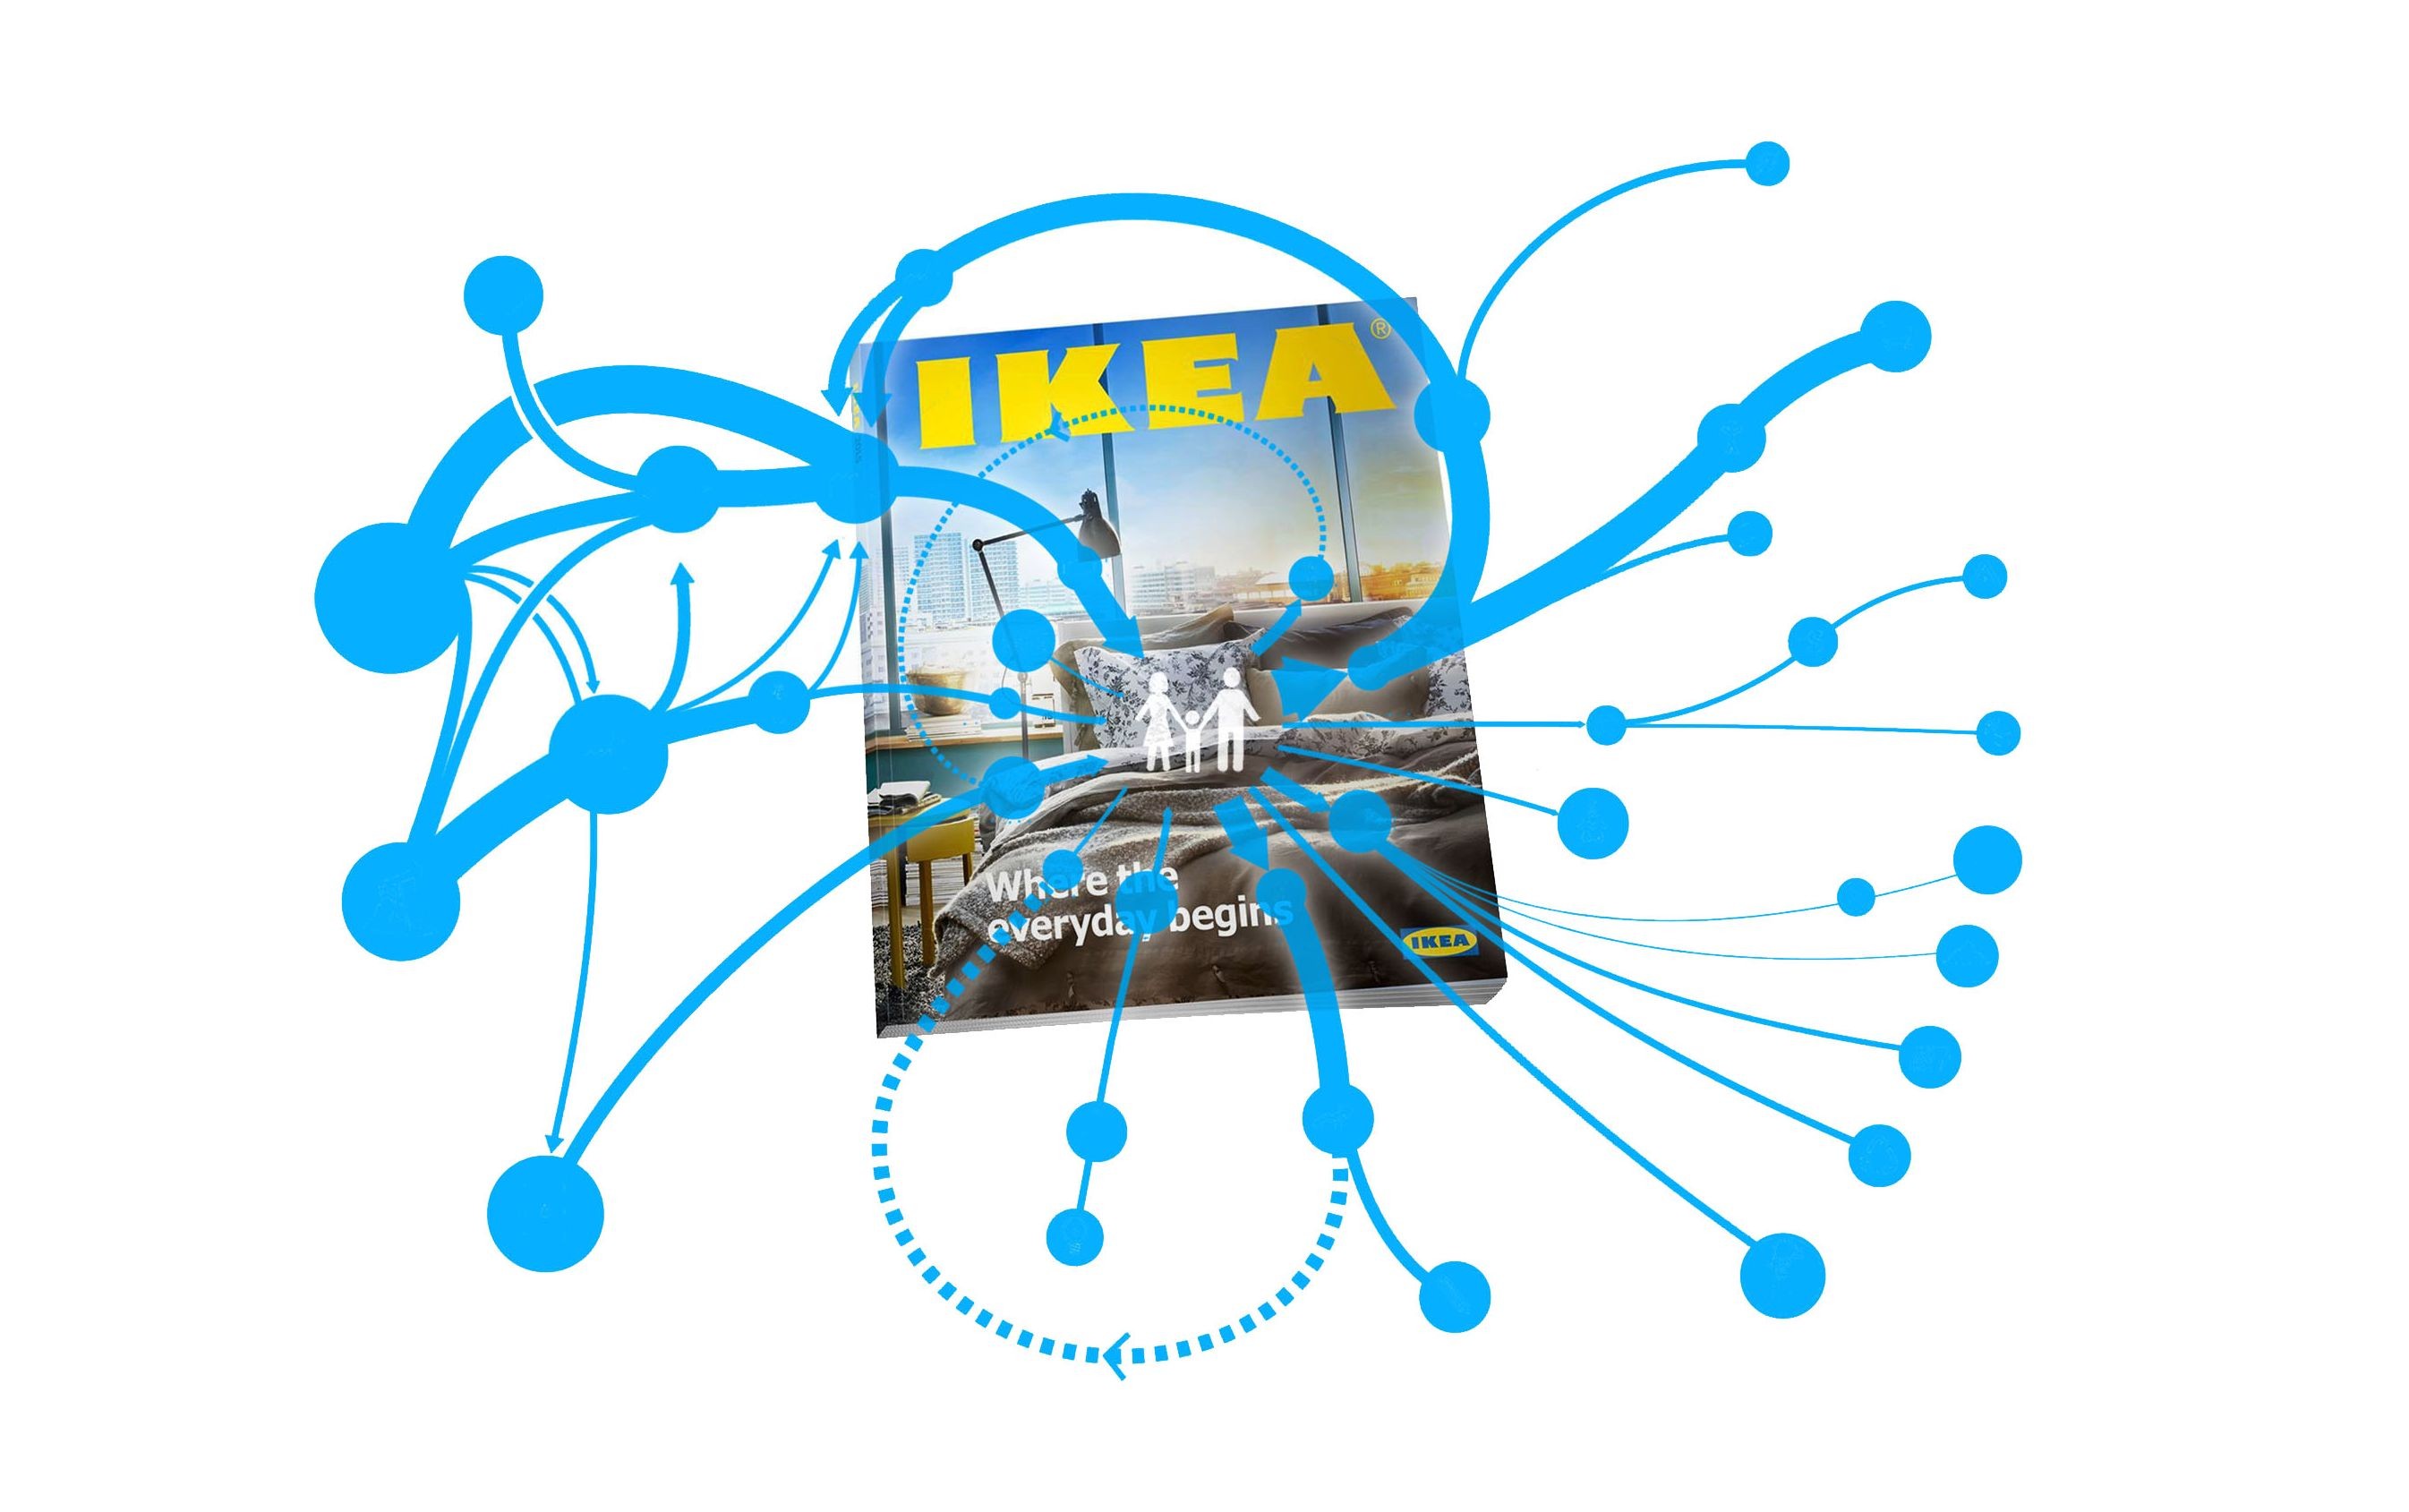
Except used the Symbiosis in Development (SiD) framework, an integrated sustainability process that combines systems thinking, network theory, and life-cycle analysis to develop a deeper understanding of systems and find areas of leverage. This unique process helps to manage transitions of organizational units over time. It implements design solutions to close physical, economic, and social loops, ensuring more sustainable and resilient systems.
Systems transition can be seen like Acupuncture. Many small interventions, when lined up, may cause a large snowball effect to help society transition. Let's look at one of those snowballing projects we achieved with the IKEA catalogue.
Information waste up-cycled
IKEA had collected high-quality Big Data on more than 100 economic and sustainability aspects of the 130 global paper mills and printing factories that produce IKEA’s catalogs. These data had simply become too much for any human mind to process.
“Except helped us turn costly ‘information waste’ into a valuable ‘information resource,’” says Matthieu Leroy, a sustainability specialist at IKEA. In the first SiD co-creation session, visualization tools offered insight into the data describing the life cycle of the catalog - from logging and paper manufacturing to print and distribution, ending with recycling and reforestation.
Participants concluded that the biggest gain could be achieved by improving the impact of already-available information. They felt data sharing with and within the supply chain would enable suppliers to compete and cooperate to create the best performance for themselves and the supply chain as a whole.
Enhancing supplier intimacy
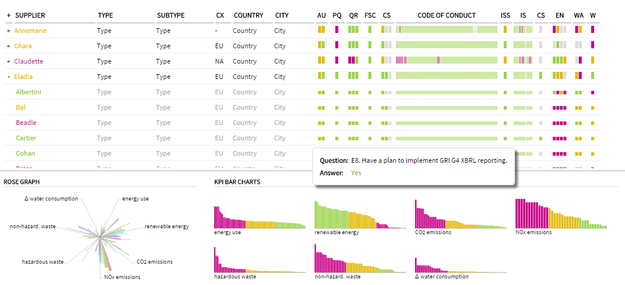
Through their "supplier brief", IKEA’s paper and print suppliers have access to much of the same (but anonymized) data, similar to how catalog purchasing managers have through their "purchaser Dashboard."
Purchasers can rate and rank supplier locations against any subset of KPIs. Suppliers receive information to find out where they stand concerning others and IKEA’s overarching green goals and it helps to prioritize corrective actions.
As a result of this shared data, and language that comes with it, IKEA and its suppliers are developing greater “supplier intimacy.” Leroy stated “this tool strengthens the collaborative dynamics they seek, ensuring negotiations are now much more focused and fruitful.”
Humanizing big data
After validating the big data and calculations in IKEA’s database, researchers clustered it into 18 Key Performance Indicators (KPIs), summarizing 100 sustainability, quality, and economic metrics of IKEA’s 130 supplier locations worldwide. Next, they designed a visual interface that intuitively displays all this data at a glance.
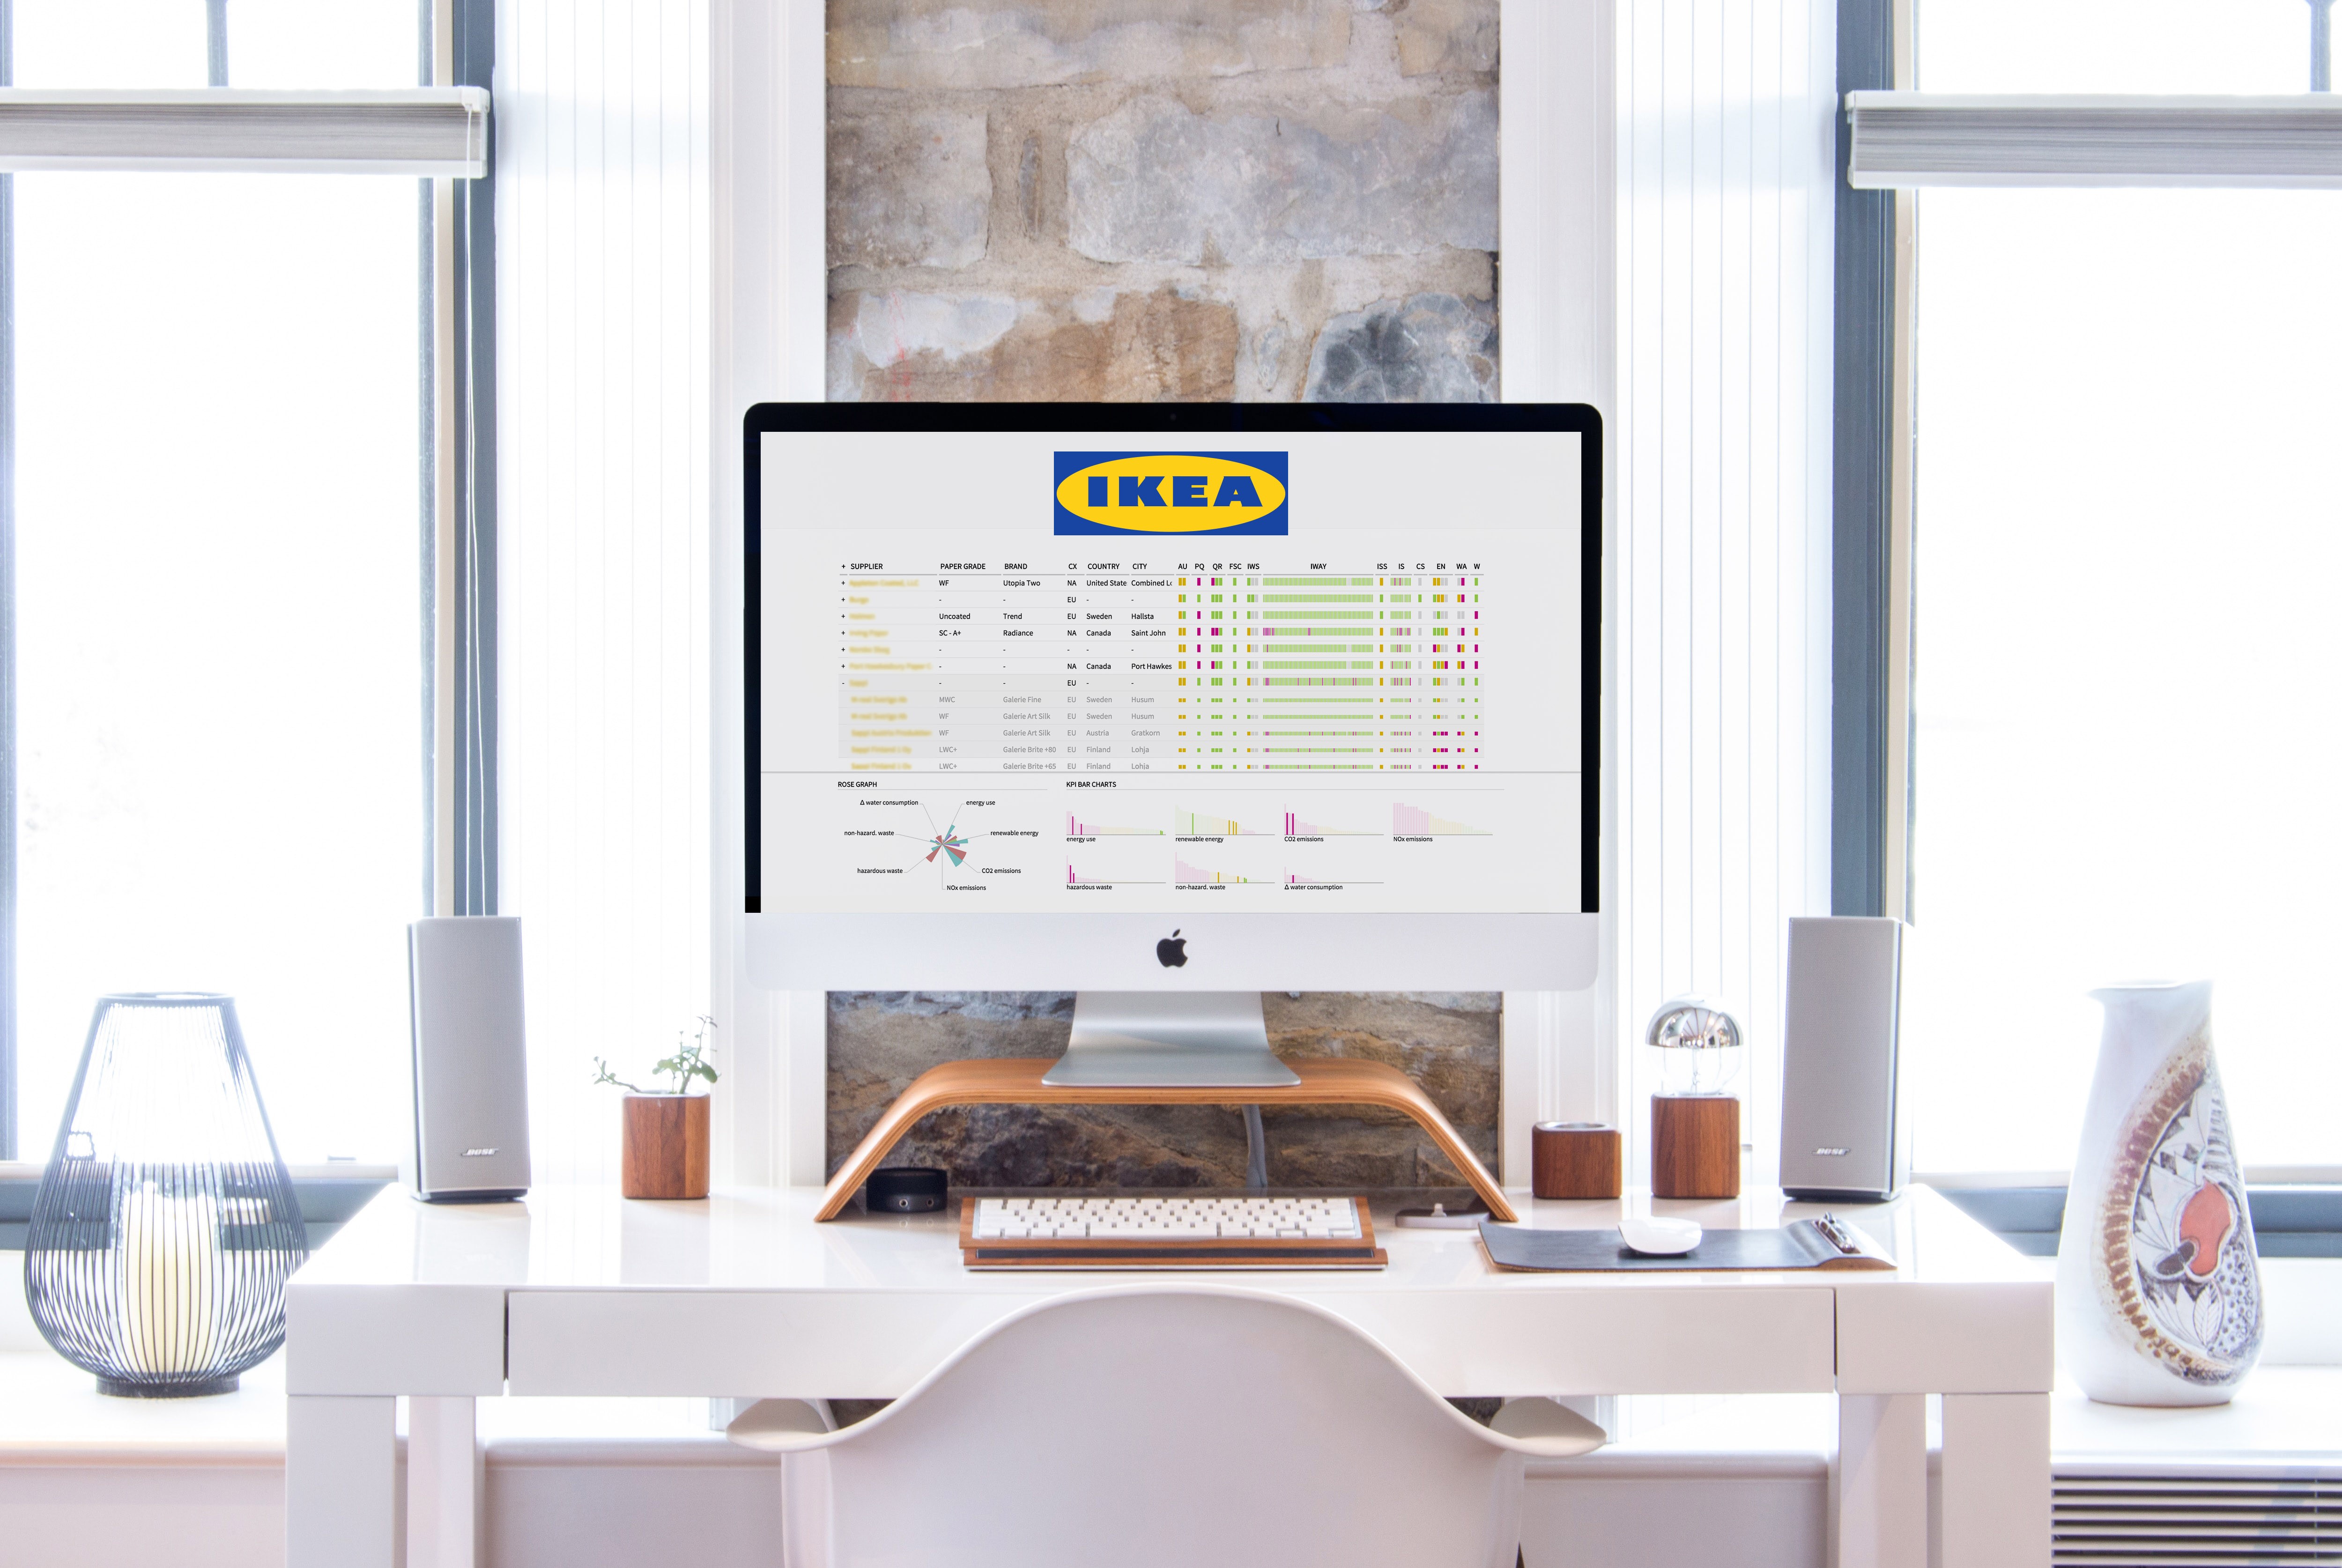
A screen of color-coded bar graphs gives the purchasers a quick overview of a supplier’s performance quality and sustainability KPIs. Mouse-overs reveal more granular data as needed. This design provides the user control over how they view and mentally process the data, leading to more holistic and better decisions.
Realizing stakeholder impact
IKEA applies a similar logic to its relations with other stakeholders outside the supply chain. It wants to build transparency and dialogue on the sustainability aspects of its catalog production process.
Enter IKEA's Data Dashboard, a compact version of the Purchaser Dashboard, minus the granular data and real-time functionalities. The Data Dashboard serves critical internal stakeholders such as co-workers and retailers. It shows the history, current status, and targets for 13 input materials, energy, CO2 emissions, and waste. The aspects are presented in the standards of the Global Reporting Initiative (GRI G4).
Data Dashboard users are invited to leave comments on the catalog’s sustainability performance and offer suggestions for future action. This process engages this critical audience in dialogue and helps IKEA know what important indicators to stakeholders.
Enabling the self-learning industry
On top of this software, Except developed "The Story of Print" to help customer-facing personnel convey IKEA’s sustainability story to its customers. Employing a storytelling approach and low information density, it informs, inspires, and invites feedback.
“The results have been beyond our expectations,” comments Leroy. The catalog’s energy consumption dropped 8% in the first year, while CO2 emissions decreased 2%. That may sound modest, but with a print run that has an energy footprint the size of the entire South Carolina economy, this adds up to 285,000 barrels of oil left in the ground each year from now on, and the CO2 emissions of 155,000 car kilometers compensated for by IKEA’s CO2 savings. These reductions have only just started to kick in and are accelerating.
“These dashboards are strengthening the interactive, collaborative dynamic with all of our stakeholders, from suppliers to NGOs to the general public,” notes Leroy. “I knew, as a big player, IKEA had the leverage to drive a transition toward greater sustainability in our paper and print supply chain. However, this project has made us an enabler of network learning at an industry level, and that’s far beyond what we had expected or could have ever imagined.”

21 oktober 2016
Andere Items

project
IKEA catalogus Toeleveringsketen Dashboards
Met meer dan 200 miljoen gedrukte exemplaren per jaar helpen de IKEA Catalogus Supply Chain Dashboards om de duurzaamheid v…
project
IKEA catalogus: het verhaal van drukwerk
IKEA Media Production nam Except in de arm om de duurzaamheidprestaties en -ambities van haar 200 miljoen exemplaren tellen…